Zilocar Reveals Where Car Theft Hits Hardest: First County-by-County Analysis of $20B U.S. Losses
WILMINGTON, Del., March 26, 2026 (GLOBE NEWSWIRE) -- A new nationwide analysis estimates that motor vehicle theft generated nearly $19.9 billion in financial losses across the United States, based on 850,236 reported vehicle thefts in the latest FBI crime dataset.
The findings come from the U.S. Car Theft Financial Impact Study, a nationwide analysis that estimates the economic impact of stolen vehicles across the country.
Unlike most crime reports that focus only on the number of stolen vehicles, the study estimates financial loss per resident and examines vehicle theft patterns across more than 2,500 U.S. counties, revealing where stolen vehicles create the greatest economic burden for local communities.
Readers can explore the interactive county-level map and full dataset here:
https://zilocar.com/research/car-theft-statistics
Key Findings
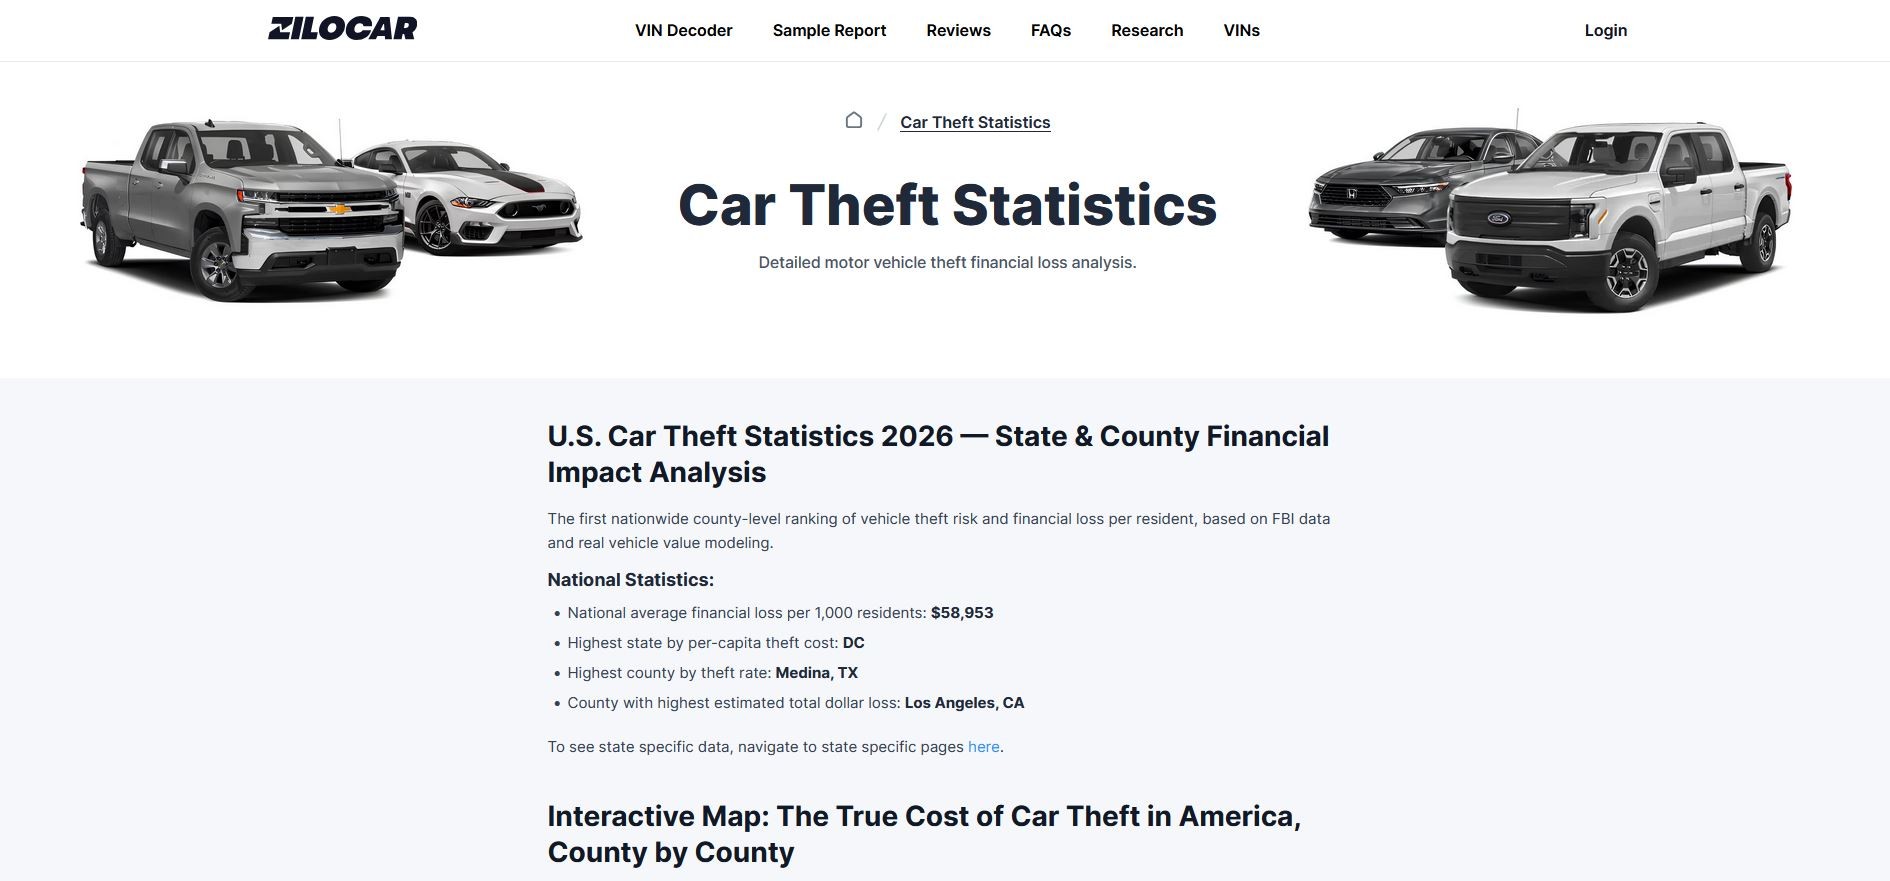
- Estimated national financial loss: $19.9 billion from 850,236 reported motor vehicle thefts.
- Average financial loss: $58,953 per 1,000 residents nationwide.
- Highest financial loss per resident: Washington, D.C. — $148,071 per 1,000 residents, roughly 2.5× the national average.
- Next highest states by per-resident loss:
- New Mexico — $124,703
- Colorado — $118,447
- New Mexico — $124,703
- Unexpected ranking pattern: Smaller states such as Colorado, Nevada, and Hawaii rank above larger states like California and Texas when theft losses are measured relative to population.
- Largest total financial losses:
- California — over $3.5 billion
- Texas — approximately $2.68 billion
- California — over $3.5 billion
The full analysis and rankings are available in the interactive research report:
https://zilocar.com/research/car-theft-statistics
County-Level Data Reveals Hidden Theft Hotspots
Most public reports analyze vehicle theft at the national or state level. This study instead examines county-level theft patterns across more than 2,500 U.S. counties, highlighting where vehicle theft creates the largest financial losses relative to population.
By estimating financial loss per resident, the analysis reveals local hotspots where theft imposes a significantly larger economic burden than statewide averages would suggest.
The interactive map of U.S. car theft statistics allows readers to explore:
- theft rates by county
- estimated financial losses
- financial loss per 1,000 residents
- total theft value by region
Readers can explore the full dataset here:
https://zilocar.com/research/car-theft-statistics
Why the Financial Impact of Car Theft Is Often Underestimated
Motor vehicle theft is classified by the FBI as a major property crime, but its economic impact often extends far beyond the value of the stolen vehicle itself.
For many households, a car represents the second-largest asset after a home. When a vehicle is stolen, victims frequently face additional financial consequences including:
- insurance deductibles
- temporary rental vehicle costs
- replacement vehicle price gaps
- depreciation losses
- long-term insurance premium increases
Because of these cascading costs, the true economic burden of vehicle theft often persists long after the initial incident.
Expert Comment
“Most theft statistics focus only on how many vehicles are stolen,” said a spokesperson for Zilocar Research, which conducted the analysis.
“But when you look at the financial impact per resident, a very different picture emerges. Some communities are experiencing far greater economic losses than statewide averages suggest.”
The full county-level analysis of car theft statistics can be explored here:
https://zilocar.com/research/car-theft-statistics
Data Sources & Methodology
The analysis combines multiple national datasets to estimate the financial impact of vehicle theft across the United States, including:
- FBI Crime Data Explorer (2024) motor vehicle theft counts
- U.S. Census Bureau county population estimates
- MarketCheck vehicle market data used to estimate average vehicle values
These datasets were used to estimate the total financial impact of stolen vehicles and calculate financial loss per resident across U.S. counties and states.
Full methodology and data sources are available in the research report:
https://zilocar.com/research/car-theft-statistics
About the Study
The U.S. Car Theft Financial Impact Study is an independent nationwide analysis conducted by Zilocar Research examining the economic impact of vehicle theft across the United States.
The study provides one of the first county-level financial impact analyses of vehicle theft nationwide, allowing readers to explore theft risk and financial loss patterns across thousands of local communities.
Media Contact
Zilocar Research
hello@zilocar.com
Disclaimer: This content is provided by Zilocar Research. The statements, views, and opinions expressed in this content are solely those of the content provider and do not necessarily reflect the views of this media platform or its publisher. We do not endorse, verify, or guarantee the accuracy, completeness, or reliability of any information presented. This content is for informational purposes only and should not be considered financial, investment, or business advice. All investments carry inherent risks, including the potential loss of capital. Readers are strongly encouraged to conduct their own due diligence and consult with a qualified financial advisor before making any investment decisions. Neither the media platform nor the publisher shall be held responsible for any inaccuracies, misrepresentations, or financial losses resulting from the use or reliance on the information in this press release. Speculate only with funds you can afford to lose. In the event of any legal claims or concerns regarding this article, we accept no liability or responsibility. Globenewswire does not endorse any content on this page.
Legal Disclaimer: This media platform provides the content of this article on an "as-is" basis, without warranties or representations of any kind, express or implied. We assume no responsibility or liability for the accuracy, content, images, videos, licenses, completeness, legality, or reliability of the information contained herein. Any complaints, copyright issues, or inquiries regarding this article should be directed to the content provider listed above.
A photo accompanying this announcement is available at https://www.globenewswire.com/NewsRoom/AttachmentNg/fc048687-d9c2-4d03-a45d-4a8b4b6fdc78

© Copyright Globe Newswire, Inc. All rights reserved. The information contained in this news report may not be published, broadcast or otherwise distributed without the prior written authority of Globe Newswire, Inc.


